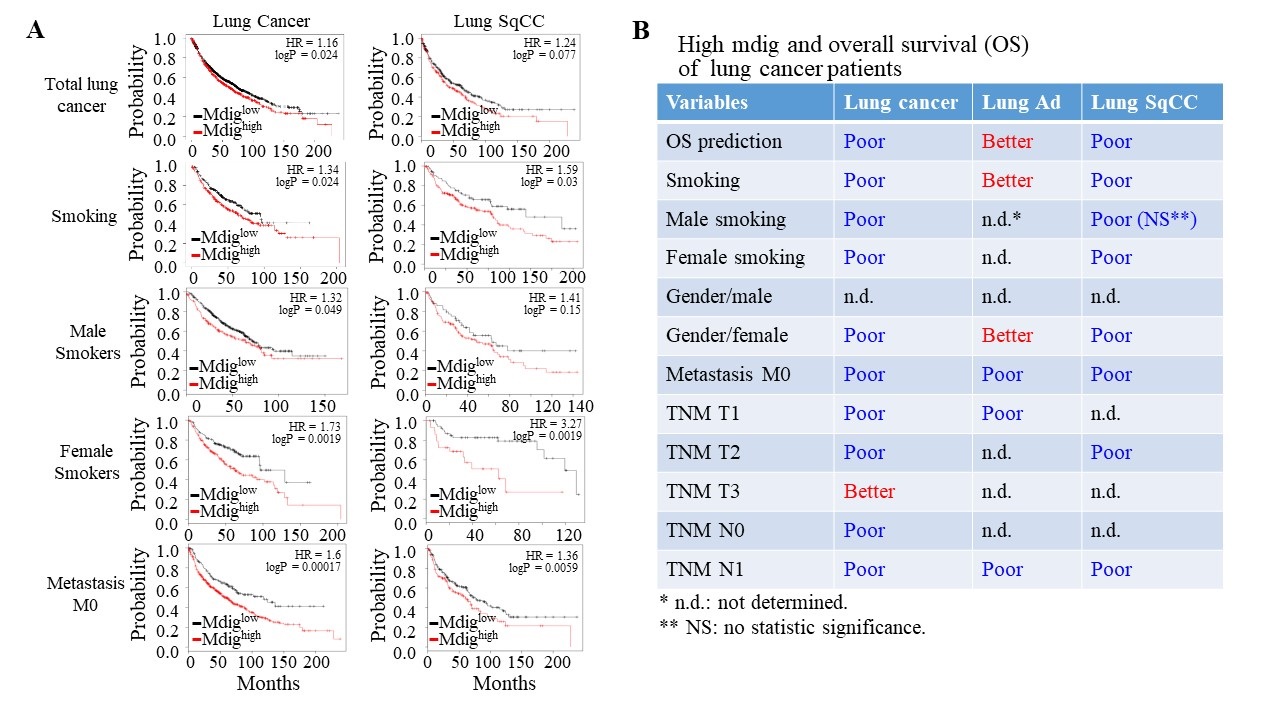
Fig. 8. mdig expression status in predicting the overall survival (OS) of lung cancer, lung Ad and Lung SqCC. (A) Kaplan-Meier probability plots of the lung cancer patients with higher or lower mdig expression (mdighigh or mdiglow). The X axis displays time in months, and the Y axis displays survival probability. (B) Summary of the prognostic power of mdig expression in predicting the OS with high mdig expression in correlation with various clinicopathological parameters including smoking, gender, cancer TNM staging, metastasis and cancer stage.